Evaluation of the Spatial Variability of Annual Precipitation Using Geostatistics in the Lorestan Province, Iran
Fatemeh Sadighi1 and Mehdi Vafakhah2 *
1
Islamic Azad University- Nour Branch,
Nour,
Iran
2
Faculty of Natural Resources,,
Tarbiat Modares University,
Iran
http://dx.doi.org/10.12944/CWE.10.Special-Issue1.120
Sufficient knowledge of the local rainfall condition and general information about the compatible actions with region’s climate in different contexts is one of the most important measures for recovery and use of water resources in drinking, agricultural, and industry sections. Considering the extent of the area and need to know the amount of rainfall occurred in different places which are far from the stations, using Geostatistical methods to determine the rainfall is especially important. Therefore, purpose of current study was to investigate the variations of the rainfall and the amount of annual precipitation and its zoning in the province. Toward this attempt, various Geostatistical models were implemented using GS+ and ArcGIS software’s. The results showed that the Co-Kriging method had less error and more correlation than Kriging and IDW. In current study, elevation is the parameters associated with the precipitation in the Co-Kriging method which is highly correlated with the rainfall with the value of 0.12.
Copy the following to cite this article:
Sadighi F, Vafakhah M. Evaluation of the Spatial Variability of Annual Precipitation Using Geostatistics in the Lorestan Province, Iran. Special Issue of Curr World Environ 2015;10(Special Issue May 2015). DOI:http://dx.doi.org/10.12944/CWE.10.Special-Issue1.120
Copy the following to cite this URL:
Sadighi F, Vafakhah M. Evaluation of the Spatial Variability of Annual Precipitation Using Geostatistics in the Lorestan Province, Iran. Special Issue of Curr World Environ 2015;10(Special Issue May 2015). Available from: http://www.cwejournal.org/?p=1105
Download article (pdf)
Citation Manager
Publish History
Introduction
Since rainfall is a spatial and temporal variable and its measurement is difficult in different locations, in short-term periods and requires high costs, therefore it is necessary to identify and use an appropriate tool for monitoring the amount of rainfall using measurement of scarce stations and exact interpolation of provided information. There are various methods for studying and zoning changes of the rainfall that each of them has a variety of accuracy depending on the circumstances of the region and the existence of enough statistics and data. On time identification and preparation of the rainfall changes maps and identification of its cause by observational and traditional methods is hard, time- consuming and costly. Nowadays, geo- statistical methods are used in order to estimate the spatial variation of the rainfall in a region. The Geo- statistical methods were developed in the year of 1690 and its application in mining and then in other sciences was spread. Also, the accessibility of data and extracting the required information for storing, maintenance, management and analysis and the increase of information in different aspects led to human thinking to use systems that could facilitate the access of broad and diverse information (Akbari, et al. 1986). The main difference of these methods and classical statistical methods is that in classical statistical methods, samples taken from a population are independent of each other, and the existence of one sample does not give any information about the subsequent samples. But, geo- statistical methods investigate existence of the spatial correlation between the values of a variable in a region. Different geo- statistical methods investigate those variables that have spatial structure, or in other words, there is a spatial relationship between different values of them, distance and their orientation. One of the best systems is the geographic information system (GIS) technology that was developed in America and Canada in 1960. From applied GIS aspects, groundwater management including design, management, optimization design and analysis of water distribution networks can be mentioned (Hassanipak, 2013).
Estimating the average regional rainfall is one of the applications of the statistical methods. In this case, Goovaerts (2000) used three geo- statistical methods with local average variable including simple Kriging with external process and co-Kriging in order to provide the annual rainfall map and annual temperature data using 36 climatology stations in a region with 5000 Square kilometers area in the Portugal. Three mentioned methods were compared using the inverse-square, linear regression with height, Tysn and ordinary Kriging using symmetric evaluation. The result of current study depicted that in circumstances with correlation coefficient of less than 0.75, simple Kriging that does not take into account the elevation, presents a better result than linear regression method. Among the compared methods, co-Kriging methods had a higher forecasting accuracy.
Drogue et al (2002) applied like Plovya, linear multivariate methods between rainfall parameters and morphological parameters derived from digital simulation, compared multivariate geo- statistical methods such as Kriging with trends and co-Kriging for the 20-year-old network data including 150 stations covering 30 Square kilometers in order to provide a simulation analysis for producing a spatial map of the Mountainous rainfall in northeastern France. Diodato and Ceccarelli (2005) produced a rainfall spatial map in the Sanyo Mountains in northern Italy using multivariate geo- statistical methods. The purpose of this study was to investigate the role of digital like writing in improving the digital interpolation process in sub-scales for providing average annual rainfall and monthly rainfall maps of 40 years in an area of 1400 square kilometers. Toward this attempt, in addition to the linear simple relationship between elevation and precipitation, ordinary Kriging method and inverse distance weighting were also used. The results showed that inverse distance weighting method had more errors than linear and ordinary Kriging. Hilaire et al (2003) evaluated the impact of hydro- climatic stations networks density on prediction of daily and annual rainfall and basin runoff in the northern part of the United States of America. The results showed that increasing the number of stations affects the quality of estimation of spatial distribution of rainfall in the region. Chen et al (2007) combined the Kriging methods and entropy in order to improve the rain-gauge network in Taiwan. The results showed that the minimum number of rain-gauge stations necessary to the region was seven stations.
Some studies have been carried out in order to prepare the spatial precipitation and drought maps in the Iran. Ghahroudi Tally (2002) evaluated the interpolation in the form of Kriging method and inverse distance weighting method in Kerman province. The results showed that Kriging simulation is more dependent on the number of sampling points and their distance from each other, so by changing them, spatial structural pattern changes. Saghafian and Rahimi Bndrabady (2005) investigated the capability of multiple interpolation methods such as the average moving weight and Kriging in order to estimate the spatial distribution of monthly and annual rainfall in the south-western Iran. The comparison of the methods with application of cross validation methods demonstrated that co- Kriging method better shows the spatial rainfall changes in the region, and has a more coordination with the topography of the region. Application of reconstructed data also reduces the accuracy of the estimation. Misaghi and Mohammadi (2006) investigated the rainfall data of Maroon region using classical statistical (Traditional) and geo- statistical methods and compared the results with estimations of artificial neural networks. The comparison of the obtained results from the aforementioned methods represented the priority of the geo- statistical methods and Kriging and co-Kriging estimation. Soleimani et al (2006) also evaluated gradient rainfall methods, classical statistical (Traditional) and geo- statistical methods in order to analyze the depth curves, level and continuing rainfall in arid and semi-arid regions. In this research, after gathering the data of 59 Rain-gauge stations located in the area of ​​research, widespread rainfall with 1 to 3 days duration were selected and were used in order to draw precipitation maps. Evaluation of the inverse distance weighting method with the powers of 1 to 3 and Kriging method depicted that Kriging method is preferred in determining the average rainfall in the study area. Therefore, the depth curves, level and the continued rain were used in order to produce rainfall maps of 1 to 3 days, and transforming pointed precipitation into average rainfall for 20 thousand square kilometers in the region became possible and rainfalls with average durations of 1 to 3 days were calculated equal to 1.98, 1.74, and 1.48 respectively. Rahimi Bandrabady and saghafian (1989) estimated the spatial distribution of the rainfall using the fuzzy theory. In this study, the capability of Kriging fuzzy method was evaluated and then was compared with methods such as ordinary Kriging and co- Kriging for estimating annual rainfall. The results showed that Kriging fuzzy method in both manners and in extrapolation of data functions was better than the other methods. In addition, by increasing the number of supplementary points, the estimation error increased. Zare Chahuki and Zare Chahuki (1993) used geo- statistical Kriging method for regional analysis and seasonal and annual rainfall estimation in catchment area 21 code in southern slope of Aborz located in Semnan province. The results showed that for seasonal and annual rainfall estimations, co- Kriging method presents accurate estimation information about the amount of rainfall by considering supplementary element of elevation and variance reduction. This precise estimation is due to the strong correlation between elevation and rainfall. Saghafian et al (1993) investigated the spatial changes of annual rainfall in the Fars province using interpolation Kriging and co- Kriging methods. The results demonstrated that plotting of Gaussian Kriging and co- Kriging models on variogram, annual rainfall data with 200 km impact range were the best pattern for interpolation of the average annual rainfall in the study area.
In this study, the rate of annual rainfall is zoned using interpolation methods of IDW, Kriging and co-Kriging in Lorestan province. In this regard, the average annual rainfall of 26 rain-gauge stations in the province that had sufficient data, were used. In order to analyze the spatial variability and the amount of rainfall in Lorestan province, Geo- statistical techniques were used through ArcGIS and GS+ softwares, so that the best model for the region to be selected.
Study Area
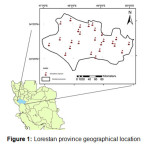
Lorestan province is located in in the range between 46 degrees and 51 minutes to 50 degrees and 30 minutes eastern longitudes and 32 degrees 37 minutes and 34 degrees and 22 minutes northern latitudes with an area of 28663.2 square kilometers. This province that is located in the West of Iran is adjacent to Hamedan province from the north, the central provinces from the North East, Kermanshah province from the North West, Isfahan Province from the East, Chahar mahal Bakhtiari province from the South East, and Khuzestan province from the south and Ilam province from the South West.
Lorestan province is a mountainous region that does not have a plain area except some valleys and small plains. Eshtarankoh is the highest point of the Lorestan province with 4150 meter elevation. The lowest point of the Lorestan province is located in the southern point of the province with the height of 500 meters above the sea level. This province in terms of the climate is a province with four seasons and has climatic diversity. This diversity is completely visible from North to South and East to West.
When in the winter the snow, storms, and extreme cold covers the north of Lorestan, the southern parts have rainy and favorable air, and when the southern regions have warm weather, the northern regions of the province have favorable climate. Also, western parts such as Sefidkuh in relation to the eastern parts namely Dorud and Aligudarz get more rainfall.
Figure (1) demonstrates the Lorestan province’s location along with the selected rain poll stations in this study
 |
|
Methodology
Since in interpolation methods the number and the distribution of the points have striking importance, in this study, we attempted to use all the existing stations in the province, however, since all of the stations didn’t have sufficient data, therefore 26 stations were used and their rainfall data was extracted and ordered in MS Excel. Then, a 40 year period of the years of 1951- 1952 till 2008- 2009, was determined for conducting this research. It is necessary to investigate the existence of a spatial structure among the data when using geo- statistical methods. This work was applied by variogram analysis. In order to run this statistical analysis, the data should be normal. Therefore, average annual rainfall of the Lorestan province stations were tested for normality. In this research, Kolmogorov- Smirnov and Shapiro- Wilk tests in SPSS showed that the data do not have the normal distribution. Therefore, for normalizing, we took logarithm of the data and again we examined the data with the aforementioned tests in order to ensure the normality of the data. The tests showed that the logarithm of the data regarding Shapiro- Wilk test has a normal distribution. After normalization, the data is transmitted to the software GS + and their variogram was examined. Geo- statistical interpolation Kriging, co-Kriging and definite IDW methods were used in this study in order to zone spatial changes and the amount of rainfall. Finally, Cross-Validation was used in order to evaluate the accuracy of geo- statistical estimates and examining the interpolation error and determining the desired parameters. In this technique, we can estimate for each of the measurement points that are usually the only comparison tools, and then compare the observed value and estimated value. Thus, in the removed Cross-Validation method, a point is removed and using other points and applying the desired interpolation method, the estimation is done for this point. The observed value and estimated value are compared and the estimation error is calculated using the average standard minimum square error (RMSE).
Results and Discussion
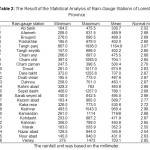
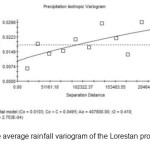
The summary of the statistical analysis of precipitation in rain-gauge stations of the province along with the results of the normal data of average precipitation are presented in Table (2). Abnormal data of average rainfall became normal using logarithmic method. And then, the experimental variogram was calculated using GS + software and the best model was selected based on minimum amount of (RSS) and maximum correlation (R2) to fit the variogram. Figure (2) shows the estimated variogram of an average rainfall.
 |
|
 |
|
The results of the analysis of the average rainfall variogram for Exponential model are represented separately in Table (3). As can be seen, Exponential model shows a high correlation coefficient and low RSS. Therefore, Exponential model was selected as the most appropriate model.
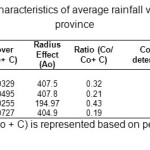 |
Table 3: The statistical characteristics of average rainfall variogram in the Lorestan province |
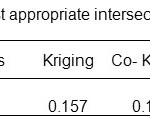
The root mean square error (RMSE) was used for determining the most appropriate method among Kriging, Co-Kriging and IDW methods. The results of the interpolation parameters using these methods are represented in table (4). As can be seen, Kriging method shows more accurate prediction and lower RMSE. The reason for the more accurate estimation of Kriging in relation to Co-Kriging is that, correlation between rainfall and elevation is lower (R= 0.12). Also, the relationship between these two parameters is reversed. This means that the amount of raining decreases due to the increase in the elevation above the sea level. That is due to locating the highest region stations in locations that are behind the entrance of the moisture to the region and the mountains impede the entrance of more rainfall to the region in which stations are located.
 |
|
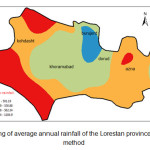
Finally, the zoning map of the mean precipitation of the province was prepared (Figure 3). In this map, it can be seen that, the average annual rainfall of the region is less than 560 mm and the climate of the region is semi-arid.
 |
|
In current study, three interpolation, inverse distance weighting, Kriging and co-Kriging methods were used for zoning annual rainfall in the Lorestan province. Two geo- statistical methods in relation to certain methods had more difference in terms of accuracy and error, and the results showed that the geo- statistical methods can predict areas without statistics with great accuracy. Also, among the geo- statistical methods, Kriging method is more accurate than Co-Kriging method.
Conclusion
Prediction of the rainfall is difficult in places with lots of ups and downs. In flat areas, prediction of precipitation has less difficulty. To estimate in watershed level a method is needed to determine moderate climatic events with precision and relative acceptability. In order to calculate the average climatic statistics, especially rainfall, from the middle of the decade of 1960, geo- statistics was introduced as an accurate and useful method. In this study, spatial rainfall changes in the Lorestan province were evaluated for the years of 1951- 1952 till 2008- 2009 (about 40 years) and zoned using Kriging and Co-Kriging geo- statistical methods and the inverse distance weighting methods (IDW). The results indicated that the Kriging method is the best method for zoning the annual rainfall with lower RMSE compared to co-Kriging and inverse distance weighting methods in the Lorestan province. The little difference between the RMSE of Kriging method (0.157) and Co-Kriging (0.192) is due to the weak correlation between precipitation and elevation. The reason for the more accurate estimation of Kriging method compared to Co-Kriging method is also the inverse correlation between precipitation and elevation above the sea level. IDW method with RMSE value of 125.5 showed that interpolation methods compared to the geo-statistical methods predict weaker the rate of spatial rainfall changes.
References
- Akbari, A., Kalantari, N., Rahimi, M. (2006). The Investigation and Evaluation of the Quality of the Underground Water Mianab Plain Shushtar using GIS, the First Regional Conference of Exploitation of Water Resources Karon and Zayandeh Rood (Opportunities and Challenges), Shahr Kord, Iran.
- Chen, Y., Wei, C., Yeh, H. (2007). Rainfall Network Design using Kriging and Entropy. Hydrol. Processes. 22(3): 340-346.
- Diodato, N., Ceccarelli, M. (2005). Interpolation Processes using Multivariate Geo-statistics for Mapping of Climatological Precipitation Mean in the Sannio Mountains (southern Italy), Earth Surface Processes and Landforms. 30: 259-268.
- Drogue, G., Humbert, J., Deraisme, N., Mahr., Freslon. N. (2002). A Statistical Topographic Model using an Omnidirectional Parameterization of the relief for Mapping Orographic Rainfall. J. Climate. 22(5): 599-613.
- Hassani pak, E. (2013). Geo- statistics. Tehran university publication. Fourth edition.
- Hilaire, A. S., Ouarda, T. B., Lachance, M., Bob, B., Gaudet, J., Gignac, C. (2003). Assessment of the Impact of Meteorological Network Density on the Estimation of basin Precipitation and Runoff: a case study. Hydrol. Processes. 17: 3561-3580.
- Ghahroudi Tally, M. (2002). The Interpolation Evaluation using Kirging Method. Geographical Researches.
- Goovaerts, P. (2000). Geo- Statistical Approaches for incorporating elevation into the spatial interpolation of rainfall. Journal of Hydrology, 228(1-2): 113-129.
- Misaghi, F., Mohammadi, K. (2006). Zoning rainfall information using classical statistics and geo- statistics methods and comparing with artificial neuron networks, agricultural scientific journal.
- Rahimi Bandar Abadi., S., Saghafiyan, B. (2007). Estimating the Spatial Distribution of Rainfall with the help of Fuzzy Theories, Water Resources Researches, Iran.
- Saghafiyan, B., Rahimi Bandar Abadi, S., (2005). The Comparison of Interpolation and Extrapolation Methods for Estimating Spatial Distribution of the amount of Annual Rainfall. Water Resources Researches, Iran.1995-2005.
- Saghafiyan, B., Razmkhah, H., ghermez cheshmeh, B. (1993). Examining the Regional Annual Rainfall Changes by geo- statistical methods application (case study, Fars province). Water Resources engineering journal. Fourth year summer 2012
- Soleimani, K., Habibnezhad, M., Abkar, E., Bani Asadi, M. (2006). The Analysis of Depth Curves, Level and Continuation of Rainfall (D.A.D) using Geo-Statistics Methods in Arid and Semi-Arid Regions (case study sult Sirjan) desert
- Water and soil journal (agriculture sciences)
- Zaree Chahkohi, A., Zaree Chahkohi, M., E. (2011). Estimating the Seasonal and Annual Rainfall using Interpolation Multivariate Methods (Case Study, southern slope of Alborz in Semnan province). Rangeland and Watershed magazine, Natural resources journal, Iran.


